
TikTok’s Algorithms and Trump’s Tulsa Rally
The event illustrates how TikTok’s algorithms can make mass political communication more accessible, but it is still no democratic utopia.

Over the summer, I crunched the numbers on about 80,000 TikTok videos pertaining to the prank on Trump’s re-election rally in Tulsa. My main interest was understanding how TikTok’s algorithms may have played a role in promoting the prank. This post summarizes findings from my workshop research paper, which was presented at the RecSys 2020 workshop on responsible recommendation.
Background
Why did the Trump administration want to ban TikTok? A few weeks ago, the app seemed to be days away from its death. And yet many of us were still asking: why, exactly, is Trump trying to ban it? Journalist Asia Ewart synthesized three of the main explanations:
- Tensions between the U.S. and China
- TikTok teens and K-pop stans tanking his Tulsa rally
- TikTok’s political power
All three of these factors likely influenced the ban, and there may be more that we never learn about. But given that the Trump administration only started taking action in July 2020, the full timeline suggests that the Tulsa prank probably served as a catalyst of some kind:
- 2017: Trump takes office
- 2018: ByteDance integrates Musical.ly into TikTok (source)
- 2019: TikTok surpasses 1 billion downloads globally (source)
- June 14, 2020: Trump’s re-election campaign boasted about record-breaking attendance (800,000+) for the upcoming rally in Tulsa
- June 20, 2020: the rally takes place with only 6,200 in attendance, at an arena with 19,000 seats (source)
- June 20, 2020: reports suggest TikTok teens and K-pop stans registered en masse for the Tulsa rally to prank the campaign with artificially inflated registration numbers
- July 7, 2020: Trump suggests banning TikTok (source)
As I read about these events, I wondered whether TikTok’s “For You” recommender algorithm played a role in promoting the prank. Because unlike Facebook, Twitter, and other platforms that primarily rely on friends, followers, or other user-determined networks, TikTok’s app takes a more proactive approach to showing you media. One journalist summarized the algorithm like this:
The first time you open the TikTok app, you select interests from a short list of categories (e.g., cooking, dancing, animals, sports, etc.). Immediately after that, TikTok’s recommender algorithm curates an infinite feed of videos “for you,” using a wide range of signals to infer your interests and further personalize the recommendations. For the most part, TikTok’s recommender algorithm seems to determine the fate of creators’ videos.
This led me to ask how TikTok’s algorithms determined the fate of videos promoting the prank on the Tulsa rally, and I conducted a small study about it with my advisor, Nick Diakopoulos. Without direct access to TikTok’s data, we were somewhat limited in finding answers, but we were still able to address three main research questions:
- How did the overall popularity patterns compare between Tulsa videos and other videos?
- How did individual users experience popularity for Tulsa videos?
- Based on statistical modeling, did Tulsa videos get a unique boost in popularity when controlling for other factors?
Dataset
We collected the dataset using an unofficial API created by David Teather. Starting with a seed of videos collected by journalist Jenna Amatulli, we snowballed the sample using hashtags and soundtracks from the seed videos. We ended up with just over 600 call-to-action Tulsa videos, encouraging users to register for tickets to the rally as a prank. Then, we collected up to 300 recent videos from all the users we came across, to set a baseline for comparison. The total dataset was about 80,000 videos.
There are a couple notable limitations with the dataset. First, all counts are rounded in TikTok’s interface, so for example, 4,300,021 plays are reported as “4.3 million plays.” Second, all plays are reported equally. A play in the “for you” page, a play from sharing the video directly, and a play from someone watching the video a fourth time — they are all counted in the same bucket. Still, the data was rich enough to provide some strong insights.
Results
1. Overall Patterns
We first looked at overall patterns in video popularity, finding that videos gain popularity on a case-by-case basis. Essentially, we found evidence for an engagement feedback loop in which likes and comments lead to more plays:
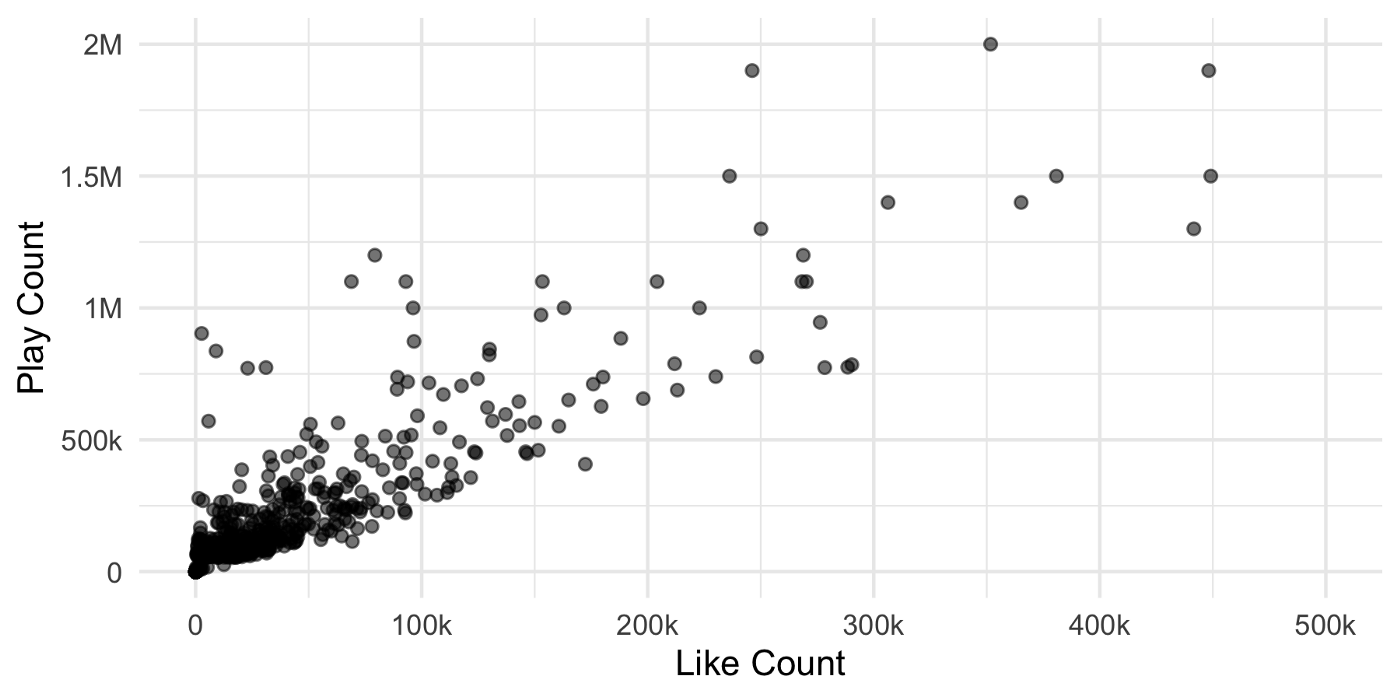
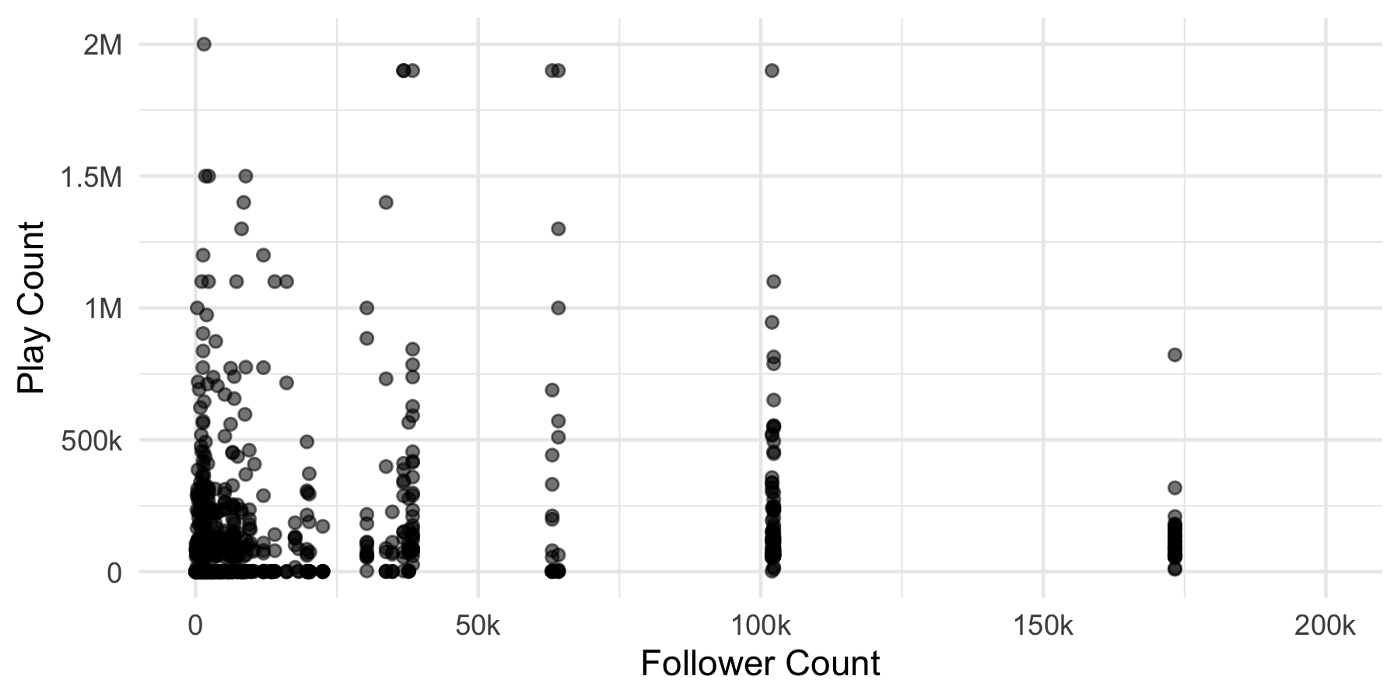
Notably, we found that creators’ audience sizes did not reliably guarantee plays for their videos. In other words, if a creator has 200,000 followers, there is no way to consistently predict how many plays their new video will attract — it depends on case-by-case numbers such as video like count and comment count, for example. This will be intuitive to many TikTok users, but our data provides some empirical evidence for the phenomenon:
This phase of the analysis also suggested that Tulsa videos (promoting the registration) were more likely to be popular than other videos. For example, 70% of Tulsa videos received fewer than 1,000 plays, while 85% of all other videos received fewer than 1,000 plays. Also, the median Tulsa-related video received 292 plays, while the median video in the rest of the dataset received 155 plays. In the graph below, the higher play counts are visualized with a clear shift to the right for the line representing Tulsa Videos:
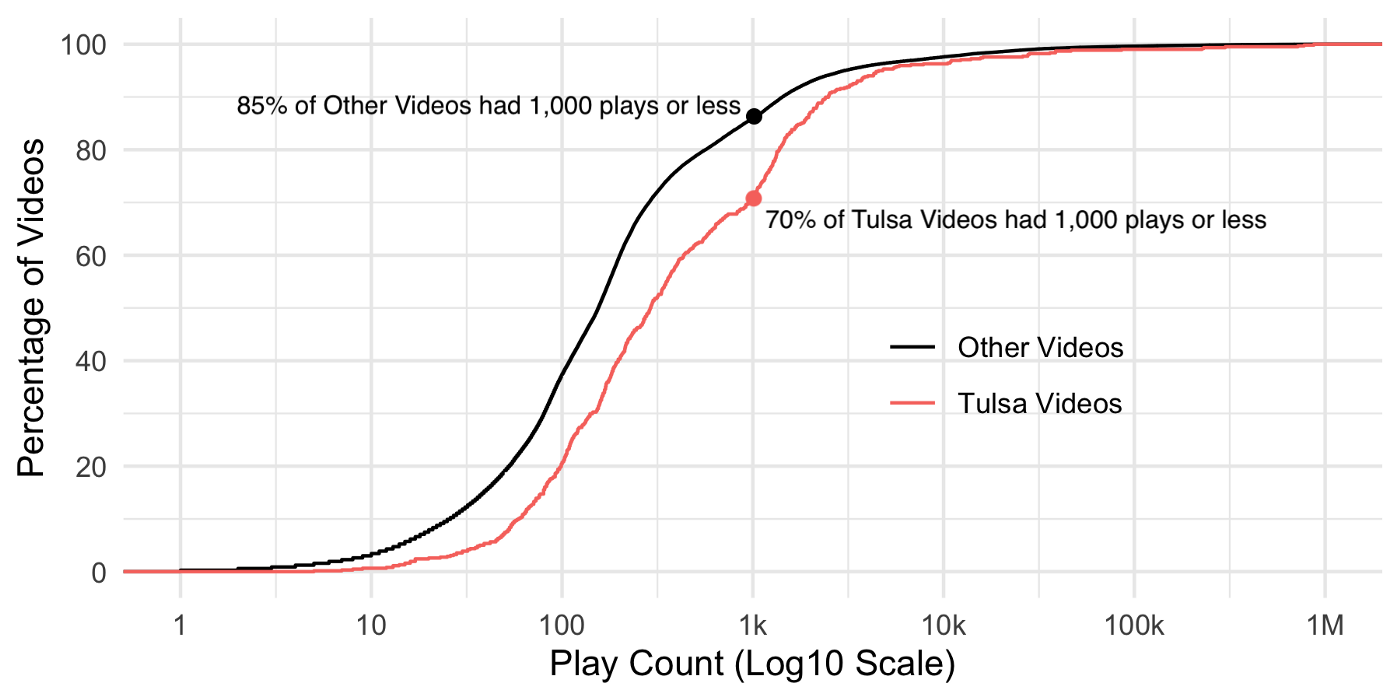
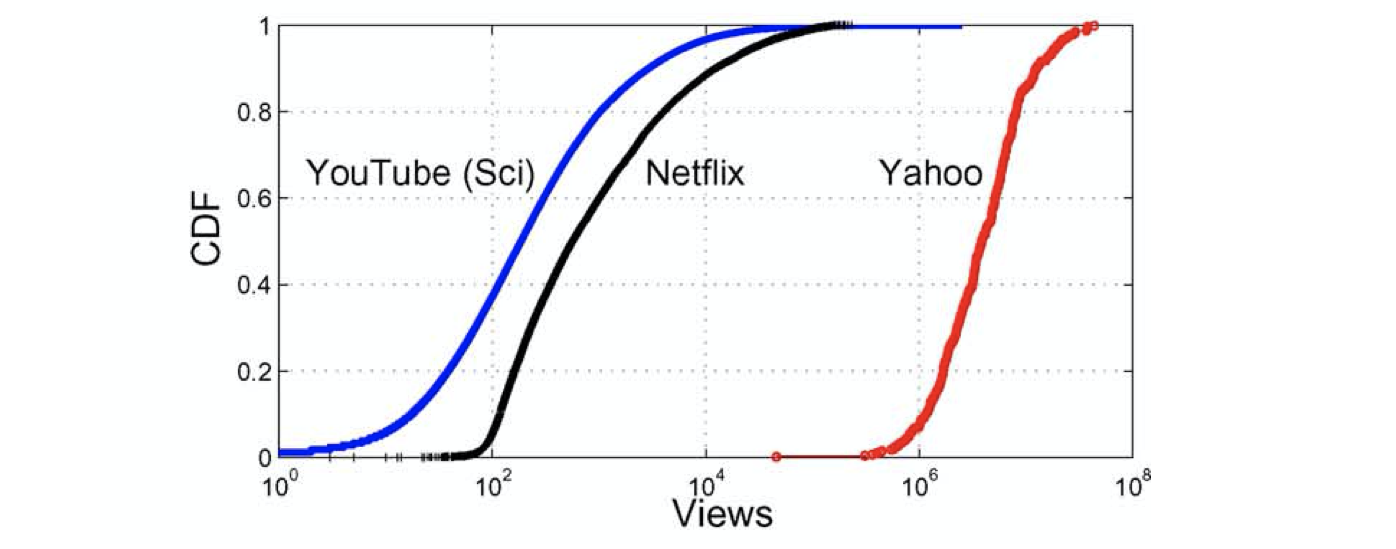
The “S curve” in the overall popularity pattern suggests a high degree of inequality. Ben West has explored inequality on TikTok, and found a Gini coefficient of 0.93 in a sample of 20,000 videos (“TikTok is almost perfectly unequal”). The Gini coefficient in our sample was 0.94, corroborating the high inequality of TikTok as a platform. Notably, this pattern is not unique to TikTok, in fact prior work suggests the “S curve” is quite common in user-generated video platforms:
2. User-Specific Patterns
In the second phase of analysis, we zoomed in on specific users to see how their Tulsa videos performed. Mary Jo Laupp’s video was the most popular Tulsa video in our dataset, and seemed to benefit from algorithmic amplification. At the time of data collection (a few days after the rally), Laupp’s video had been played well over 2 Million times, even though she only had about 18,000 followers, and her second most-popular video had less than 100,00 plays. In a graph of all her videos, the Tulsa Video towers above every other one:
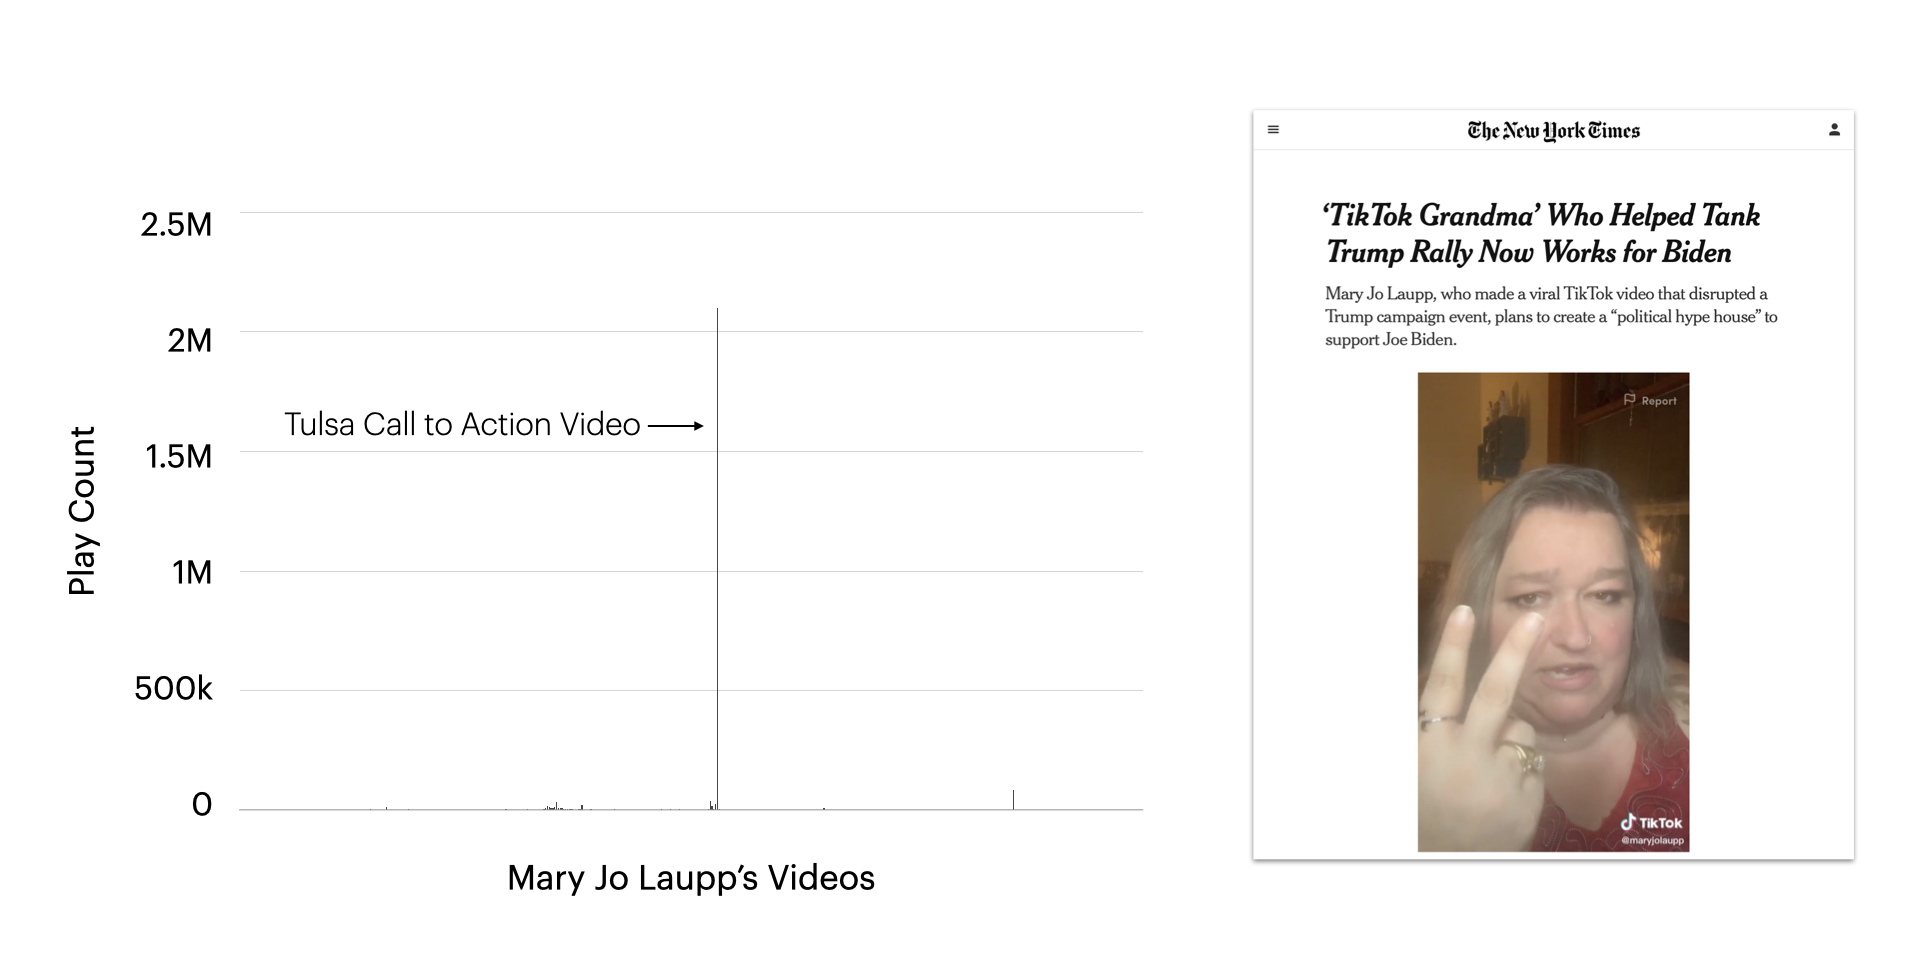
We found a few similar cases, as we report in the paper, though most did not experience a drastic boost like Mary Jo Laupp. Still, for 76% of users in the dataset, their Tulsa video received more plays than their median video, evidencing the overall increased popularity for Tulsa Videos.
3. Statistical Modeling
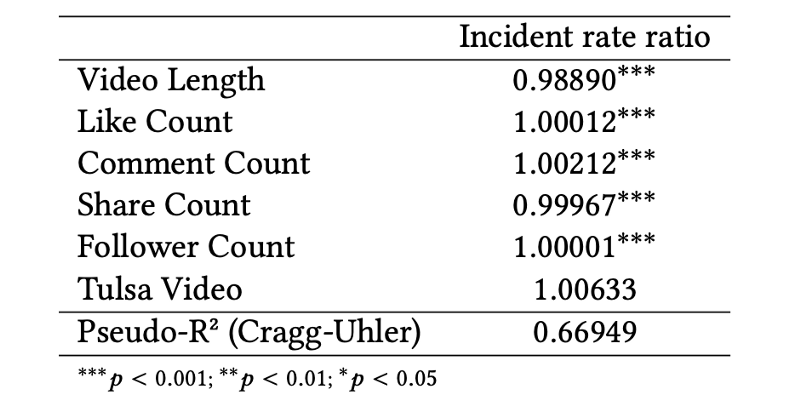
Finally, we used statistical modeling to determine whether Tulsa videos experienced a systematic increase in popularity. Again, our dataset could not account for everything, but we were able to control for factors like video length and engagement statistics (i.e. like count, comment count, share count), and a Pseudo-R² suggested that these factors explained about 67% of the variation in the data.
Tulsa Videos received higher engagement, which led to higher play counts
Based on our statistical modeling, Tulsa videos did not experience a systematic increase in popularity. Rather, they received higher play counts due to higher engagement, the same as other popular videos in our dataset. In other words, we find no evidence that TikTok’s algorithms gave special treatment to Tulsa videos.
There are more statistical details in the paper (e.g. correlation tests and Wilcoxon signed rank tests), which point to the same conclusion: Tulsa Videos attracted more engagement from users, which led to more plays, but they did not get a special treatment from TikTok’s algorithms.
Limitations
Even in a blog post like this, it is important to note the limitations of scientific research. We had to use rounded statistics from TikTok, and we may have missed some relevant videos when collecting data. The biggest limitation, given our research question, is that we used overall play count to estimate popularity in the algorithmic For You page. In other words, we could not tell the difference between “plays from the For You page” and “plays from elsewhere.” This is a standard limitation in media exposure research, but an important one to note.
It is also worth noting that TikTok’s transparency efforts could provide more information about the videos recommended by the algorithm. For example, they could publish a list of videos that the algorithm has recommended 500,000 times or more, which would help provide some accountability.
So What?
The big takeaway from our analysis, to me, is that TikTok users get to help decide which videos become popular. In many cases, TikTok creators do not need a large following to reach a large audience, they only need an engaging video. The principle is fairly simple and used on other platforms, but TikTok seems to have cracked the code and fine-tuned their algorithms, de-emphasizing the role of friends/followers.
In some ways, this makes TikTok a very democratic platform, since users can essentially “vote” for which videos become popular by simply liking, commenting on, sharing, or finishing a video. And indeed, creators often ask viewers to “like and share to boost this video,” “keep the ratio high,” or (my personal favorite) “juice up this video.” How should TikTok handle this behavior? Instagram has taken a punitive approach¹. Personally, I hope TikTok recognizes that this kind of behavior is not “gaming the system,” rather, it is basically voting for which videos people see in the app.
On the issue of voting and democracy, it is worth also considering the fact that TikTok does not allow political advertising. In my view, this makes TikTok something of a threat to authoritarian leaders, especially considering the democratic, grassroots-style voting for video popularity. But, at the same time, TikTok itself is centralized and authoritarian in some ways. The platform regularly removes millions of videos, and its powerful algorithms produce stark inequality — the top 1% of videos in our dataset accounted for 76% of all plays. Also, despite transparency efforts, the platform’s opacity has been underscored in its new method for paying creators, which users say is “riddled with problems.”
In short, TikTok is not merely a fun app for sharing videos: it has real-world social, political, and economic consequences that demand further attention. Sometimes, the consequences are entertaining, such as the prank on Trump’s Tulsa rally, or the total revamping of Ocean Spray’s brand after Nathan Apodaca drank its cranberry juice in an iconic TikTok.
But sometimes the consequences are not as amusing as pranks on Trump or cranberry juice branding. We know algorithms like TikTok’s can amplify dangerous false claims, extremist messaging, and other problematic media, such as the anti-semitic meme that TikTok amplified in July.
Whether the consequences are amusing or alarming, it is increasingly clear that TikTok substantially influences society. Given this influence, we should continue holding TikTok accountable for the messages it amplifies and the inequalities it creates. The app may present a threat to authoritarian leaders, but it is still quite far from a democratic utopia.
If you have any questions or comments about the research I summarized in this post, please reach out to me!
¹Caitlin Petre, Brooke Erin Duffy, and Emily Hund wrote a fascinating research paper about Instagram pods. Victoria O’Meara also wrote a fantastic paper about the phenomenon. Both helped inform my research immensely.